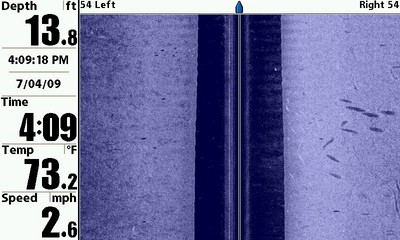
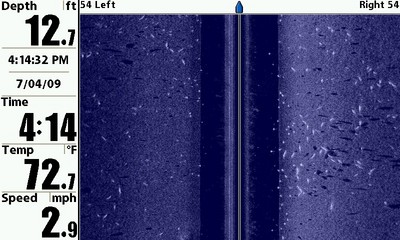
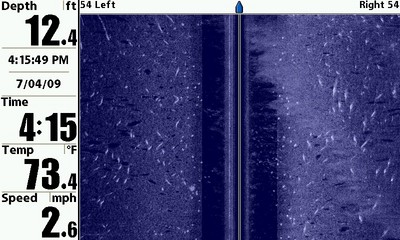
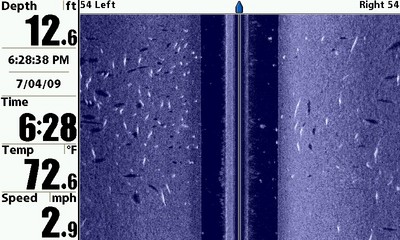
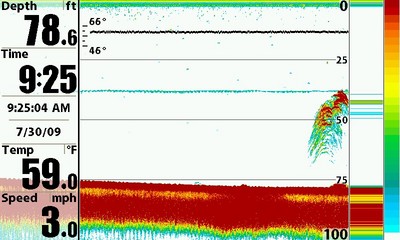
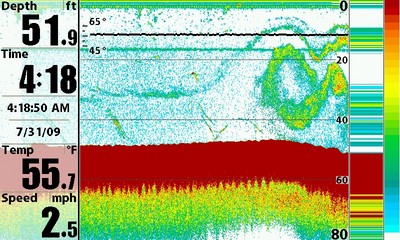
More fish pics

  • whittsend
    Posts: 2389
    #1294859

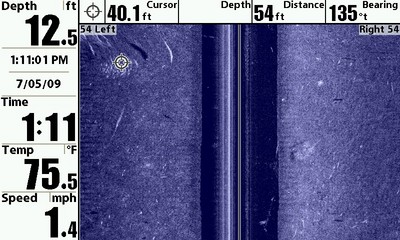
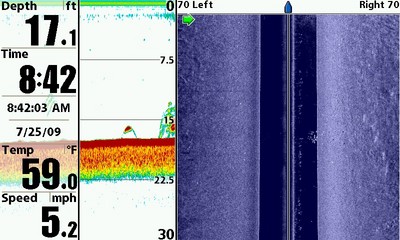
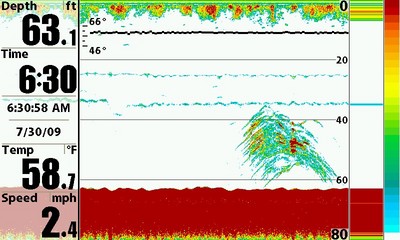
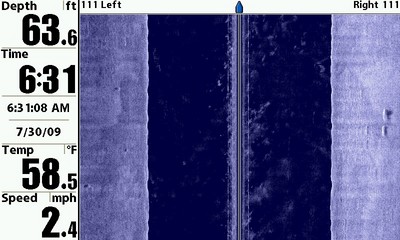
    On the 6th pic you can see the fish on both the SI and 2d.

    The 8th pic is two BIG kings or lakers (or browns??) sitting on the bottom on the right side.


    whittsend
    Posts: 2389
    #800254

    1st 3 and last one are salmon…

    4-7 are scattered, suspended crappies and gils. (LOTS of them)


    francisco4
    Holmen, WI
    Posts: 3607
    #800263

    Question. The last picture in your first set. Is that baitfish?

    Thanks,

    FDR

    whittsend
    Posts: 2389
    #800266

    Yup, on Lake Michigan. Lots of baitfish out there. Pretty cool swirly pattern. You can also see scattered arcs or harder marks which would be salmon up on the chew…

    Mike

    whittsend
    Posts: 2389
    #800269

    Jason – question for you…

    On the 2d images, there is a temperature history graph… It shows a range of 20 degrees. Not particularly helpful since its just about one solid line. Can that range be adjusted? Instead of 45 degrees to 65 degrees, for example, can that range be adjusted to 53 to 58 degrees? Or 60 to 67 degrees?? The 20 degree range doesn’t impress me, but if the graph happened to show smaller temp variations better (like 1-4 degree surface temp anomoly) that feature would be much more useful. Even a 10 degree range would be a big improvement.

    Any ideas?

    Mike

    jhalfen
    Posts: 4179
    #800275

    Mike, I only know how to toggle it off and on.

    I’ll forward your comments up the line at HB. Maybe it’s part of the 2010 software update? If not, I think it would make a nice addition in the future.

    whittsend
    Posts: 2389
    #800284

    Yup, I agree. Would be VERY nice to set that manually, especially for hunting for slicks or surface temp breaks on lake Michigan, etc…..

    Maybe have it “automatic” in the sense that the range is appropriate for current conditions (for example, not showing a graph of 40-45 degrees whe the temp is actually 68 degrees), but user-settable from 20 degree range all the way down to 1-2 degree range… ???

    Thanks for suggesting that to the gurus at HB!!

    Mike

    jhalfen
    Posts: 4179
    #800322

    Mike, just heard from the higher-ups at Humminbird:

    Quote:


    You can not make any changes to the Temperature graph. The only thing you can do is turn it on or off. I do not know of any future software changes.


    Sorry! Good idea, nevertheless!

    francisco4
    Holmen, WI
    Posts: 3607
    #800354

    Is the black line in the upper 1/4 of the screen the temp. graph that you guys are referring to?

    Thanks,

    FDR

    whittsend
    Posts: 2389
    #800361

    Yup, it is on the 2-D images. It has the temp range hash marks on the left, and the black line graph goes across the screen to the right. A 20 degree range doesn’t help much. 5 degrees would be much more useful.

    Mike

Viewing 10 posts - 1 through 10 (of 10 total)

You must be logged in to reply to this topic.